Sunday, March 22, 2020

FRANK Solutions for Class 9 Maths Chapter 22 - Statistics

FRANK Solutions for Class 9 Maths Chapter 22 - Statistics

Chapter 22 - Statistics Exercise Ex. 22.1

Question 1
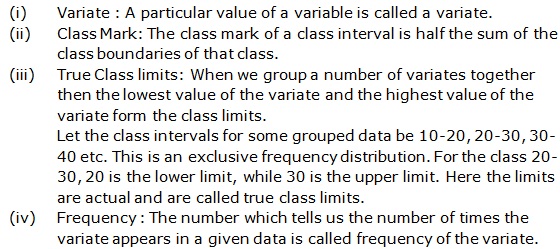
Frank Solutions Icse Class 9 Mathematics Chapter - Statistics
Solution 1
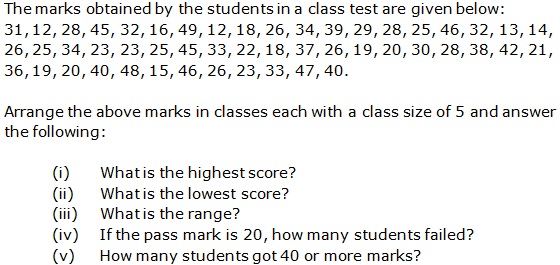
Frank Solutions Icse Class 9 Mathematics Chapter - Statistics
Question 2
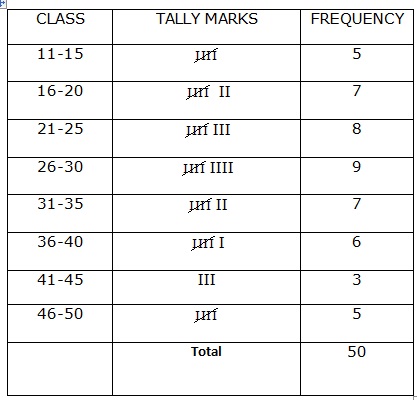
Frank Solutions Icse Class 9 Mathematics Chapter - Statistics
Solution 2
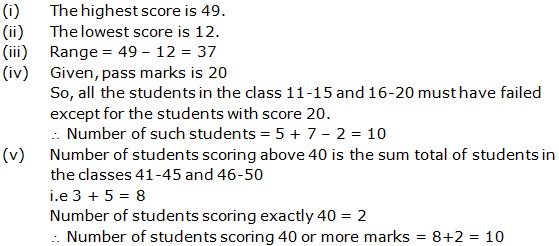
Frank Solutions Icse Class 9 Mathematics Chapter - Statistics
Question 3
Frank Solutions Icse Class 9 Mathematics Chapter - Statistics
Solution 3
Frank Solutions Icse Class 9 Mathematics Chapter - Statistics
Question 4
Frank Solutions Icse Class 9 Mathematics Chapter - Statistics
Solution 4
Frank Solutions Icse Class 9 Mathematics Chapter - Statistics
Question 5
Frank Solutions Icse Class 9 Mathematics Chapter - Statistics
Solution 5
Frank Solutions Icse Class 9 Mathematics Chapter - Statistics
Question 6
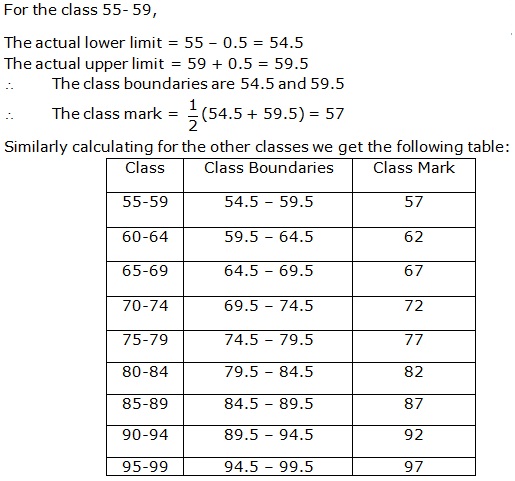
Find the actual (or true) lower and upper class limits and class-marks (or mid values) of the following classes: 2.1 - 4.0, 4.1 - 6.0 and 6.1 - 8.0.
Solution 6
Frank Solutions Icse Class 9 Mathematics Chapter - Statistics
Question 7
Observe the given frequency table to answer the following:
Class Interval
20-24
25-29
30-34
35-39
40-44
45-49
Frequency
6
12
10
15
9
2

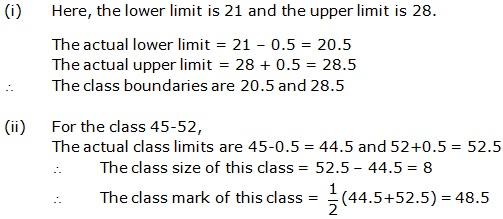
a. The true class limits of the fifth class.
b. The size of the second class.
c. The class boundaries of the fourth class.
d. The upper and lower limits of the sixth class.
e. The class mark of the third class.
Solution 7
Frank Solutions Icse Class 9 Mathematics Chapter - Statistics
Question 8
Frank Solutions Icse Class 9 Mathematics Chapter - Statistics
Solution 8
Frank Solutions Icse Class 9 Mathematics Chapter - Statistics
Question 9
Frank Solutions Icse Class 9 Mathematics Chapter - Statistics
Solution 9
Frank Solutions Icse Class 9 Mathematics Chapter - Statistics
Question 10
Frank Solutions Icse Class 9 Mathematics Chapter - Statistics
Solution 10
Frank Solutions Icse Class 9 Mathematics Chapter - Statistics
Question 11
Frank Solutions Icse Class 9 Mathematics Chapter - Statistics
Solution 11
Frank Solutions Icse Class 9 Mathematics Chapter - Statistics
Question 12
Frank Solutions Icse Class 9 Mathematics Chapter - Statistics
Solution 12
Frank Solutions Icse Class 9 Mathematics Chapter - Statistics

Chapter 22 - Statistics Exercise Ex. 22.2

Question 1
Frank Solutions Icse Class 9 Mathematics Chapter - Statistics
Solution 1
Frank Solutions Icse Class 9 Mathematics Chapter - Statistics
Question 2
Frank Solutions Icse Class 9 Mathematics Chapter - Statistics
Solution 2
Frank Solutions Icse Class 9 Mathematics Chapter - Statistics
Question 3
Frank Solutions Icse Class 9 Mathematics Chapter - Statistics
Solution 3
Frank Solutions Icse Class 9 Mathematics Chapter - Statistics
Question 4
Frank Solutions Icse Class 9 Mathematics Chapter - Statistics
Solution 4
Frank Solutions Icse Class 9 Mathematics Chapter - Statistics
Question 5
Construct a frequency distribution table from the given cumulative frequency distribution showing the weights of 750 students in a school:

Weight (in kg)
c.f.
More Than 25
750
More Than 30
640
More Than 35
615
More Than 40
485
More Than 45
370
More Than 50
220
More Than 55
124
More Than 60
49
More Than 65
24
More Than 70
0

a. Find the number of students whose weight lie in the interval 40-45
b. Find the interval which has the most number of students.
Solution 5
Frequency distribution table is as follows:

Weight (in kg)
c.f.
25 - 30
110 (750 - 640)
30 - 35
25 (640 - 615)
35 - 40
130 (615 - 485)
40 - 45
115 (485 - 370)
45 - 50
150 (370 - 220)
50 - 55
96 (220 - 124)
55 - 60
75 (124 - 49)
60 - 65
25 (49 - 25)
65 - 70
24 (24 - 0)
70 - 75
0

a. The number of students whose weight lie in the interval 40 - 45 is 115.
b. The interval 45 - 50 has the most number of students.

Chapter 22 - Statistics Exercise Ex. 22.3

Question 1
Frank Solutions Icse Class 9 Mathematics Chapter - Statistics
Solution 1
Frank Solutions Icse Class 9 Mathematics Chapter - Statistics
Question 2
Frank Solutions Icse Class 9 Mathematics Chapter - Statistics
Solution 2
Frank Solutions Icse Class 9 Mathematics Chapter - Statistics
Question 3
Frank Solutions Icse Class 9 Mathematics Chapter - Statistics
Solution 3
Frank Solutions Icse Class 9 Mathematics Chapter - Statistics
Question 4
Frank Solutions Icse Class 9 Mathematics Chapter - Statistics
Solution 4
Frank Solutions Icse Class 9 Mathematics Chapter - Statistics
Question 5
Frank Solutions Icse Class 9 Mathematics Chapter - Statistics
Solution 5
Frank Solutions Icse Class 9 Mathematics Chapter - Statistics
Question 6
The daily maximum relative humidity (in per cent) in Mumbai from May 1 to May 7, 1992 is given below:
64, 70, 65, 80, 75, 78
Find the mean.
Solution 6
Frank Solutions Icse Class 9 Mathematics Chapter - Statistics
Question 7
Frank Solutions Icse Class 9 Mathematics Chapter - Statistics
Solution 7
Frank Solutions Icse Class 9 Mathematics Chapter - Statistics
Question 8
Frank Solutions Icse Class 9 Mathematics Chapter - Statistics
Solution 8
Frank Solutions Icse Class 9 Mathematics Chapter - Statistics
Question 9
Frank Solutions Icse Class 9 Mathematics Chapter - Statistics
Solution 9
Frank Solutions Icse Class 9 Mathematics Chapter - Statistics
Question 10
Frank Solutions Icse Class 9 Mathematics Chapter - Statistics
Solution 10
Frank Solutions Icse Class 9 Mathematics Chapter - Statistics
Question 11
Frank Solutions Icse Class 9 Mathematics Chapter - Statistics
Solution 11
Frank Solutions Icse Class 9 Mathematics Chapter - Statistics
Question 12
The mean of 16 natural numbers is 48. Find the resulting mean, if each of the number is
a. increased by 5
b. decreased by 8
c. multiplied by 4
d. divided by 0.25
e. increased by 50%
f. decreased by 10%
Solution 12
Frank Solutions Icse Class 9 Mathematics Chapter - Statistics
Question 13
The mean of 4 observations is 20. If one observation is excluded, the mean of the remaining observations becomes 15. Find the excluded observation.
Solution 13
Frank Solutions Icse Class 9 Mathematics Chapter - Statistics
Question 14
The mean monthly income of 8 men is Rs. 8079.75. A man whose monthly income is Rs. 8280 has also been taken into consideration. Calculate the mean monthly income of all the men.
Solution 14
Frank Solutions Icse Class 9 Mathematics Chapter - Statistics
Question 15
The mean of 200 observations is 20. It is found that the value of 180 is wrongly copied as 280. Find the actual mean.
Solution 15
Frank Solutions Icse Class 9 Mathematics Chapter - Statistics
Question 16
Frank Solutions Icse Class 9 Mathematics Chapter - Statistics
Solution 16
Frank Solutions Icse Class 9 Mathematics Chapter - Statistics
Question 17
Frank Solutions Icse Class 9 Mathematics Chapter - Statistics
Solution 17
Frank Solutions Icse Class 9 Mathematics Chapter - Statistics
Question 18
Frank Solutions Icse Class 9 Mathematics Chapter - Statistics
Solution 18
Frank Solutions Icse Class 9 Mathematics Chapter - Statistics
Question 19
The following data has been arranged in ascending order.
0, 1, 2, 3, x + 1, x + 5, 20, 21, 26, 29.
Find the value of x, if the median is 5.
Solution 19
Frank Solutions Icse Class 9 Mathematics Chapter - Statistics
Question 20
Frank Solutions Icse Class 9 Mathematics Chapter - Statistics
Solution 20
Frank Solutions Icse Class 9 Mathematics Chapter - Statistics

0 comments:

Post a Comment