FRANK Solutions for Class 9 Maths Chapter 23 - Graphical Representation of Statistical Data
Chapter 23 - Graphical Representation of Statistical Data Exercise Ex. 23.1
Question 1
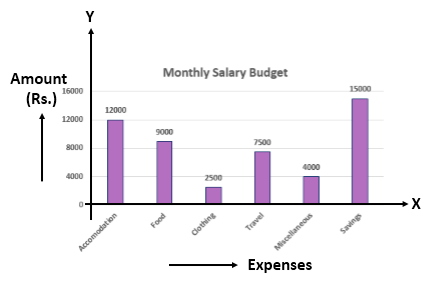
Harmeet earns Rs.50 000 per
month. He a budget for his salary as per the following table:
Expenses
|
Accommodation
|
Food
|
Clothing
|
Travel
|
Miscellaneous
|
savings
|
Amount (Rs.)
|
12000
|
9000
|
2500
|
7500
|
4000
|
15000
|
Draw
a bar graph for the above data.
Solution 1
The bar graph is as follows:
Question 2
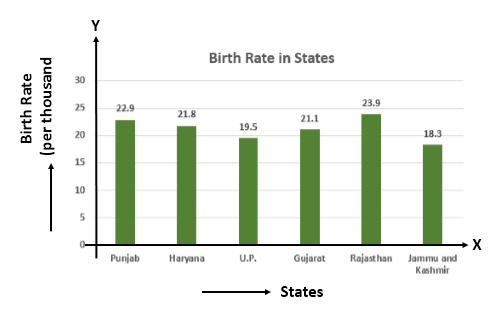
The
birth rate thousand of the following states over a certain period is given
below:
States
|
Punjab
|
Haryana
|
U.P.
|
Gujarat
|
Rajasthan
|
Jammu and kashmir
|
Birth Rate (per thousand )
|
22.9
|
21.8
|
19.5
|
21.1
|
23.9
|
18.3
|
Draw
a bar graph for the above data.
Solution 2
The bar graph is as follows:
Question 3
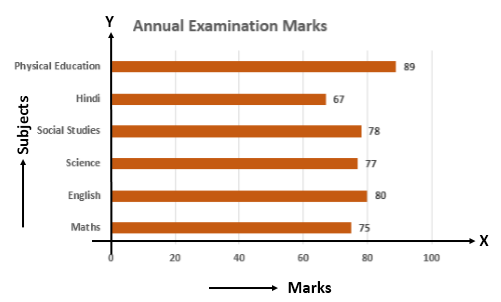
Fadil, a class IX student,
scored market in different subjects (each out of total 100) during his annual
examination as given below:
Subject
|
Maths
|
English
|
Science
|
Social studies
|
Hind
|
Physical education
|
Mark (out of 100)
|
75
|
80
|
77
|
78
|
67
|
89
|
Draw
horizontal bar graph for the above data.
Solution 3
The horizontal bar graph is as follows:
Question 4
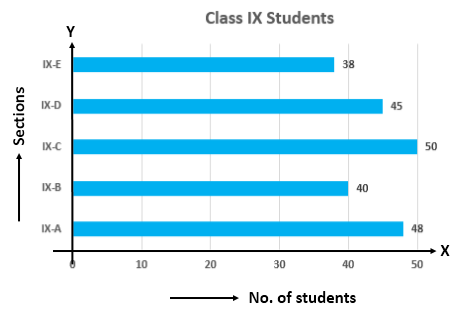
The
number of students in different sections of class IX of a certain school is
given in the following table.
Section
|
IX-A
|
IX-B
|
IX-C
|
IX-D
|
IX-E
|
Number of students
|
48
|
40
|
50
|
45
|
38
|
Draw
horizontal bar graph for the above data.
Solution 4
The horizontal bar graph is as follows:
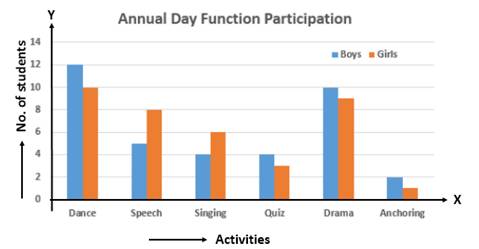
Question 5
The
number of students (boys and girls) of class IX participating in different
activities during their annual day function is given below:
Activities
|
Dance
|
Speech
|
Singing
|
Quiz
|
Drama
|
Anchoring
|
Boys
|
12
|
5
|
4
|
4
|
10
|
2
|
Girls
|
10
|
8
|
6
|
3
|
9
|
1
|
Draw
a double bar graph for the above data.
Solution 5
The double bar graph is as follows:
Question 6
Solution 6
Question 7
Solution 7
Question 8
Solution 8
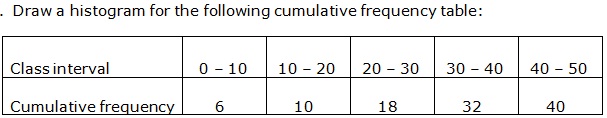
Question 9
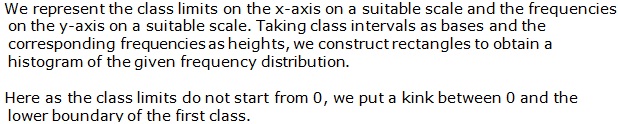
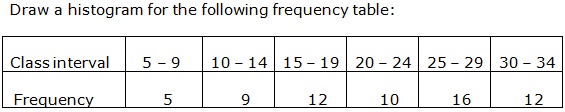
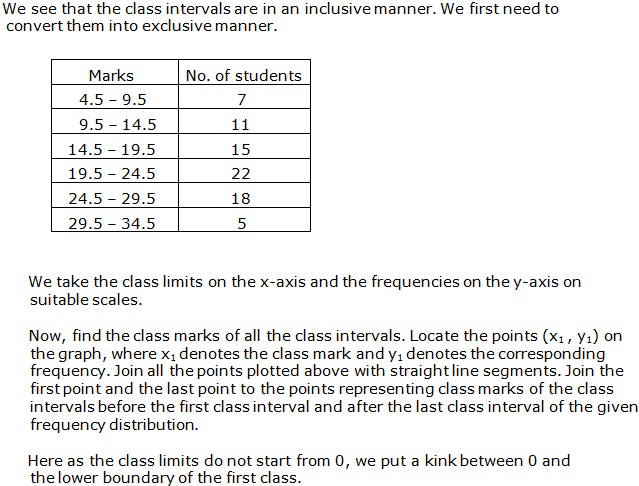
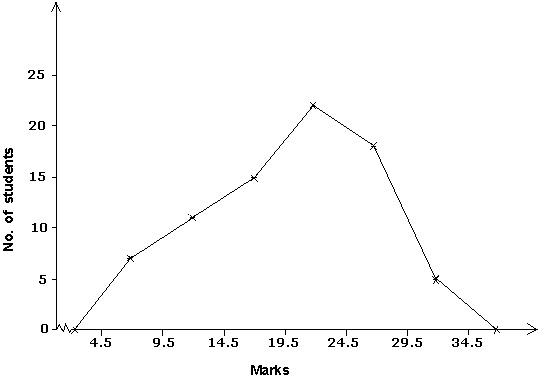
Draw
a histogram for the following cumulative frequency table:
Marks
|
Less than 10
|
Less than 20
|
Less than 30
|
Less than 40
|
Less than 50
|
Less than 60
|
Number of student
|
7
|
18
|
30
|
45
|
55
|
60
|
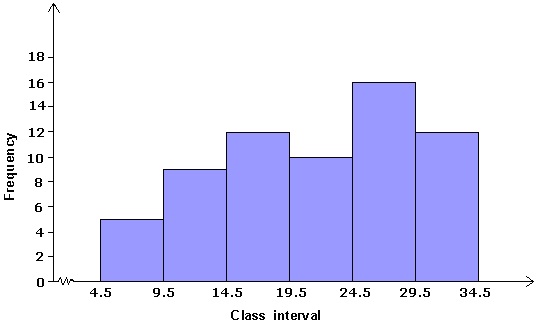
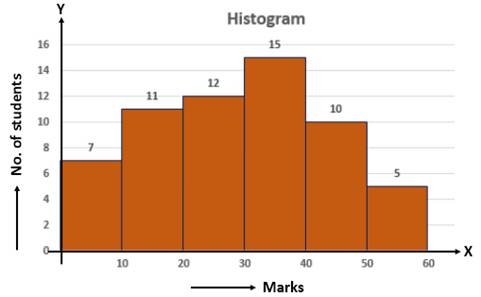
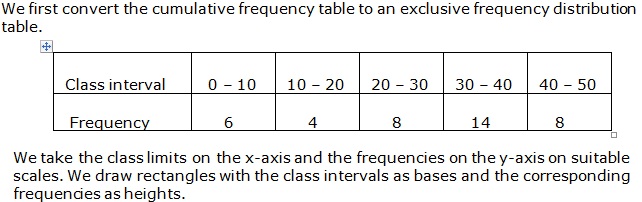
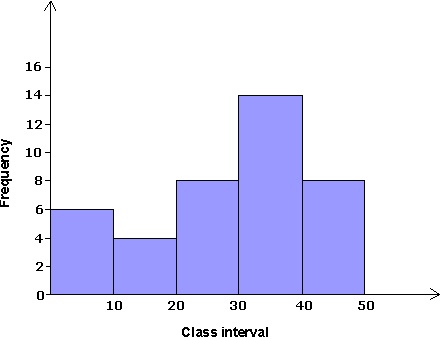
Solution 9
Marks
|
0 - 10
|
10 - 20
|
20 - 30
|
30 - 40
|
40 - 50
|
50 - 60
|
Number of students
|
7
|
11
|
12
|
15
|
10
|
5
|
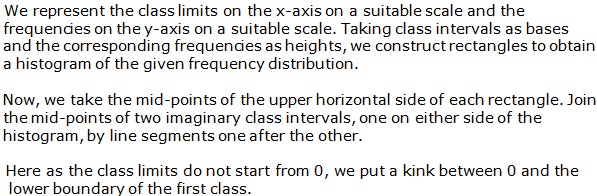
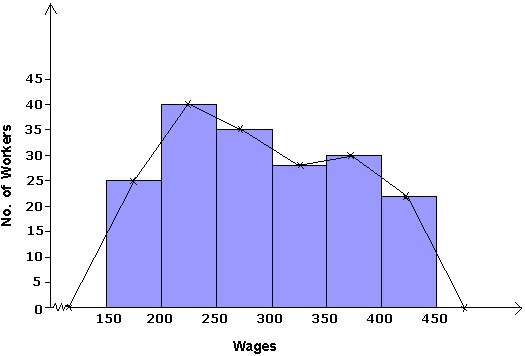
The histogram is as follows:
Question 10
Solution 10
Question 11
Solution 11
Question 12
Solution 12
Question 13
Solution 13
Question 14

Solution 14
14
Question 15
Solution 15
Question 16
Read
the following bar graph and answer the following questions:
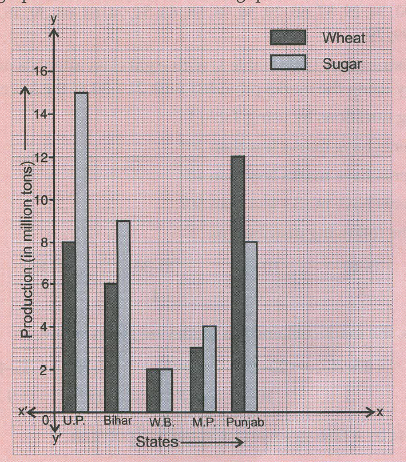
a. What information is given by the
graph?
b. Which state is the largest
producer of wheat?
c. Which state is the largest
producer of sugar?
d. Which state has total production
of wheat and sugar as its maximum?
e. Which state has the total
production of wheat and sugar minimum?
Solution 16
- The information about Production of wheat and sugar (in million tons) in five different states (U.P., Bihar, W.B., M.P., Punjab) is given in the graph.
- Punjab is the largest producer of wheat.
- U.P. is the largest producer of sugar.
- U.P. has total production of wheat and sugar as its maximum.
- W.B. has the total production of wheat and sugar minimum.

0 comments:
Post a Comment